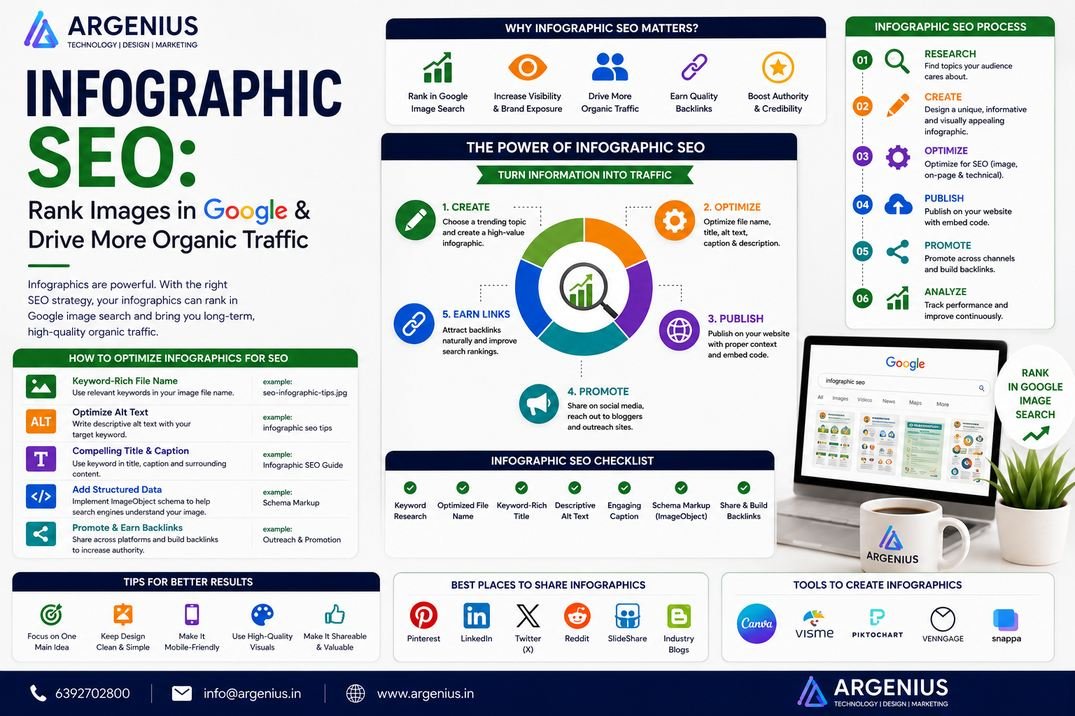
Learn how Infographic SEO improves Google Image rankings, increases backlinks, drives organic traffic, and enhances your overall SEO strategy through optimized visual content.
Introduction
Visual content has become one of the most effective ways to communicate information online. Instead of reading long paragraphs, users often prefer infographics that simplify complex ideas into easy-to-understand visuals. This shift in user behavior has made Infographic SEO an essential part of modern digital marketing and search engine optimization.
An infographic is much more than a visually appealing image. When properly optimized, it can rank in Google Images, attract backlinks from other websites, increase brand visibility, and generate consistent organic traffic. Since infographics are highly shareable, they also help improve social engagement and establish your website as a trusted source of information.
Google increasingly understands images through artificial intelligence, image recognition, structured data, and surrounding page content. At the same time, AI-powered search platforms such as Google AI Overviews, ChatGPT, Gemini, and Perplexity rely on well-structured visual content to provide richer search experiences. This makes image optimization more valuable than ever before.
Many businesses invest significant time creating high-quality infographics but overlook the SEO elements that determine whether those visuals are discoverable in search results. Factors such as descriptive filenames, ALT text, image compression, surrounding content, and internal linking all contribute to image rankings.
Whether you operate a software company, ecommerce business, educational website, healthcare portal, or digital marketing agency, optimizing infographics can become an important source of long-term organic traffic.
In this guide, you'll learn what Infographic SEO is, why it matters, how Google ranks images, and the best practices for improving your visibility in Google Images and AI-powered search.
At Argenius, we create SEO-focused visual content strategies that help businesses increase search visibility, attract backlinks, and generate sustainable organic traffic.
What is Infographic SEO?
Infographic SEO is the process of optimizing infographics so they can rank higher in Google Images, appear in image search results, and support overall website SEO.
It involves optimizing both the image itself and the webpage where it is published.
Key optimization areas include:
- Image Filename
- ALT Text
- Image Compression
- Captions
- Structured Data
- Surrounding Content
- Internal Linking
- Mobile Optimization
- Page Speed
- User Experience
The goal is to make infographics easy for both users and search engines to understand.
Why Infographic SEO is Important
Optimized infographics provide several SEO benefits.
They help businesses:
- Increase Google Image Rankings
- Generate Organic Traffic
- Earn Quality Backlinks
- Improve Content Engagement
- Increase Social Shares
- Build Brand Authority
- Improve User Experience
- Support AI Search Visibility
- Strengthen Content Marketing
- Improve Overall SEO Performance
Unlike ordinary images, infographics often continue attracting visitors long after publication.
How Google Ranks Infographics
Google evaluates multiple factors before ranking an infographic in image search.
These include:
- Image Relevance
- ALT Text
- File Name
- Image Quality
- Page Authority
- Surrounding Content
- Structured Data
- Internal Links
- Page Speed
- Mobile Friendliness
The infographic itself is important, but the webpage around it also plays a major role.
Benefits of Infographic SEO
Businesses investing in infographic optimization often experience:
- Higher Google Image Rankings
- Increased Organic Traffic
- Better Brand Awareness
- More Backlinks
- Improved User Engagement
- Longer Time on Page
- Better Social Sharing
- Increased Lead Generation
- Stronger AI Search Visibility
- Higher Content Value
These benefits make infographics a valuable long-term SEO asset.
Types of SEO Infographics
Different infographic formats serve different purposes.
Popular types include:
Statistical Infographics
Present data, charts, and research findings.
Process Infographics
Explain workflows or step-by-step procedures.
Comparison Infographics
Compare products, services, tools, or technologies.
Timeline Infographics
Display historical events or project milestones.
Educational Infographics
Teach concepts using visuals and simplified explanations.
Checklist Infographics
Present tasks in an easy-to-follow visual format.
Image SEO vs Infographic SEO
| Image SEO |
Infographic SEO |
| Optimizes all images |
Focuses on infographic content |
| Basic image optimization |
Combines design + SEO |
| Improves image rankings |
Improves image rankings & backlinks |
| Simple visuals |
Information-rich graphics |
| Supports page SEO |
Supports complete content marketing |
Elements of an SEO-Friendly Infographic
A successful infographic should include:
- High-Quality Design
- Readable Typography
- Clear Hierarchy
- Brand Logo
- Relevant Statistics
- Descriptive Title
- Optimized File Name
- ALT Text
- Compressed File Size
- Mobile-Friendly Layout
Both design and SEO are equally important.
Infographic SEO and AI Search
AI-powered search engines increasingly understand visual content.
Optimized infographics help improve visibility in:
- Google AI Overviews
- ChatGPT
- Gemini
- Perplexity
AI systems prefer visuals that:
- Explain concepts clearly
- Include structured information
- Support surrounding content
- Demonstrate expertise
- Provide educational value
Industries That Benefit from Infographic SEO
Infographic SEO is valuable for many industries, including:
- Software Development
- SaaS
- Healthcare
- Finance
- Education
- Ecommerce
- Real Estate
- Travel
- Manufacturing
- Digital Marketing
Any business publishing educational content can benefit from infographic optimization.
Common Mistakes in Infographic SEO
Avoid these common mistakes:
- Large File Sizes
- Missing ALT Text
- Generic File Names
- Poor Mobile Experience
- Low Image Quality
- Missing Surrounding Content
- No Internal Links
- Duplicate Visuals
- Missing Captions
- Ignoring Structured Data
Fixing these issues significantly improves image discoverability.
Step-by-Step Infographic SEO Strategy
Creating an infographic is only half the job. To rank in Google Images and generate organic traffic, you need to optimize both the image and the webpage where it appears. Follow this proven strategy to maximize the SEO value of every infographic.
Step 1: Choose the Right Topic
Start with a topic that users actively search for and that can be explained visually.
Examples include:
- SEO Checklist
- Website Development Process
- Mobile App Development Lifecycle
- Digital Marketing Funnel
- Content Marketing Strategy
- Ecommerce Statistics
- Google Ranking Factors
- Cybersecurity Best Practices
Select topics that simplify complex information into an easy-to-understand visual format.
Step 2: Perform Keyword Research
Identify keywords related to your infographic.
Research:
- Primary Keyword
- Secondary Keywords
- Long-Tail Keywords
- Question-Based Keywords
- Search Volume
- User Intent
Example:
Primary Keyword:
Infographic SEO
Supporting Keywords:
- Google Image SEO
- Image Optimization
- Image Search
- Visual SEO
- Google Images
- Image Ranking
Use these naturally in the page title, headings, and image attributes.
Step 3: Create a High-Quality Infographic
Your infographic should be:
- Easy to Read
- Visually Appealing
- Mobile Friendly
- Well Structured
- Data Driven
- Brand Consistent
- Professionally Designed
Avoid overcrowding the design with excessive text or decorative elements.
Step 4: Optimize the Image File
Before uploading:
Rename the file using descriptive keywords.
Example:
Instead of:
Use:
Also:
- Compress the image.
- Use WebP where possible.
- Maintain high visual quality.
- Avoid unnecessarily large dimensions.
Optimized images load faster and improve SEO.
Step 5: Add Descriptive ALT Text
ALT text helps search engines understand image content.
Example:
"Infographic explaining Infographic SEO techniques for ranking images in Google Search."
Write natural descriptions that accurately represent the image while including the primary keyword when appropriate.
Step 6: Publish Supporting Content
Never upload an infographic without supporting text.
Include:
- Introduction
- Topic Explanation
- Key Insights
- Statistics
- FAQs
- Conclusion
Google relies on surrounding content to understand the context of an image.
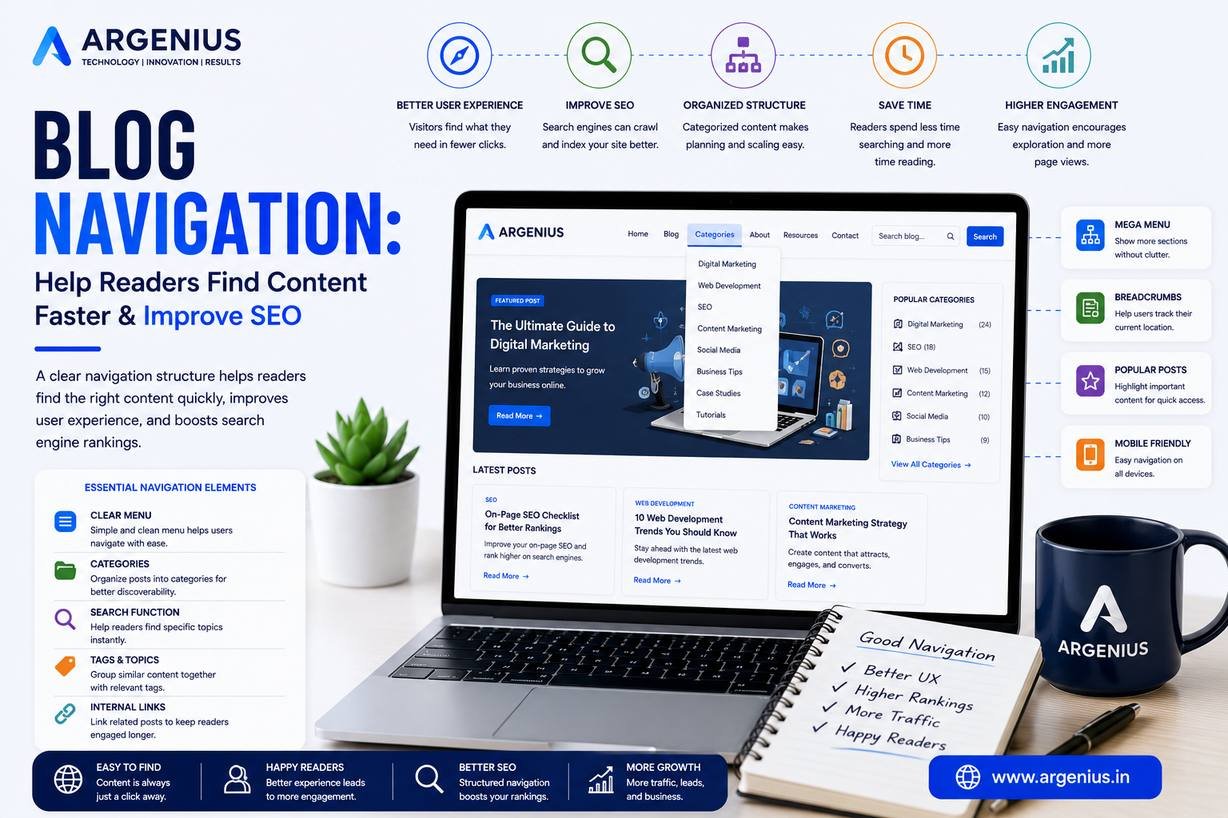
Step 7: Build Internal Links
Link your infographic page to:
- Related Blog Posts
- Pillar Pages
- Service Pages
- Case Studies
- Resource Pages
Strong internal linking improves crawlability and user engagement.
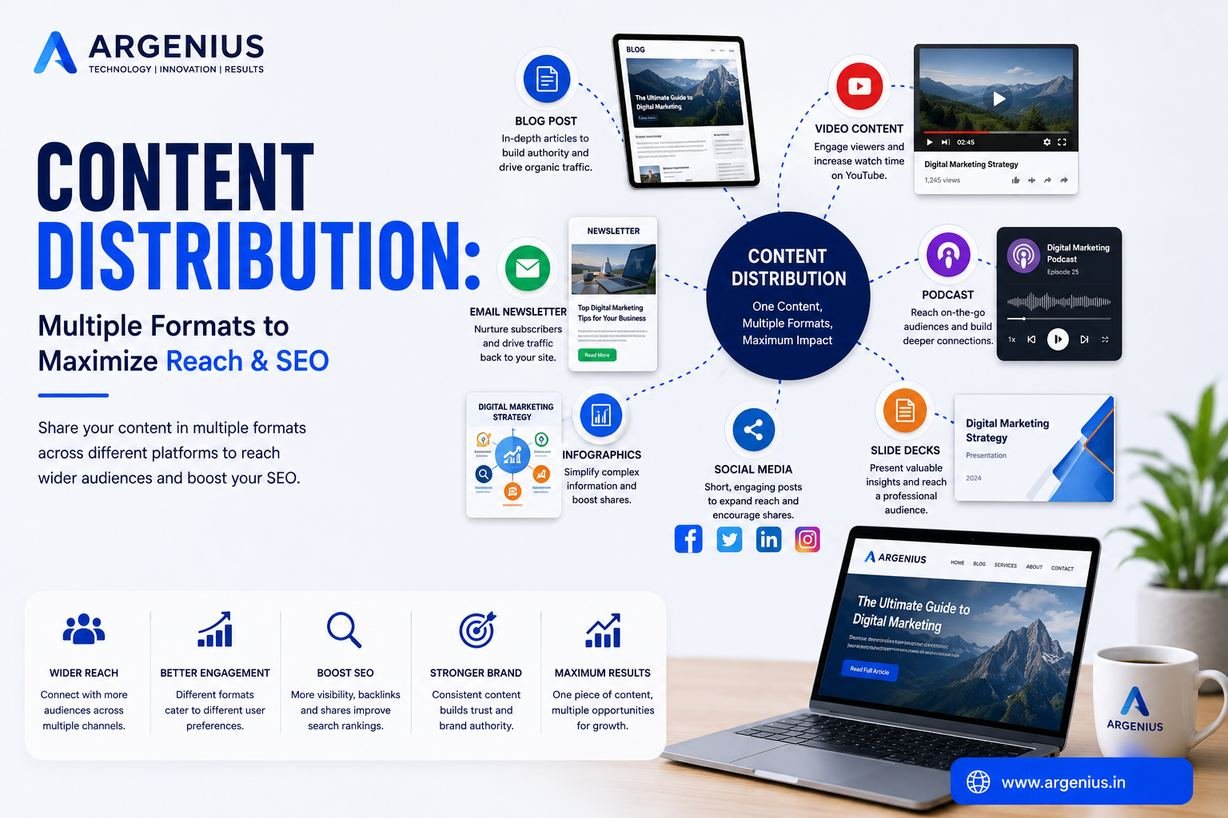
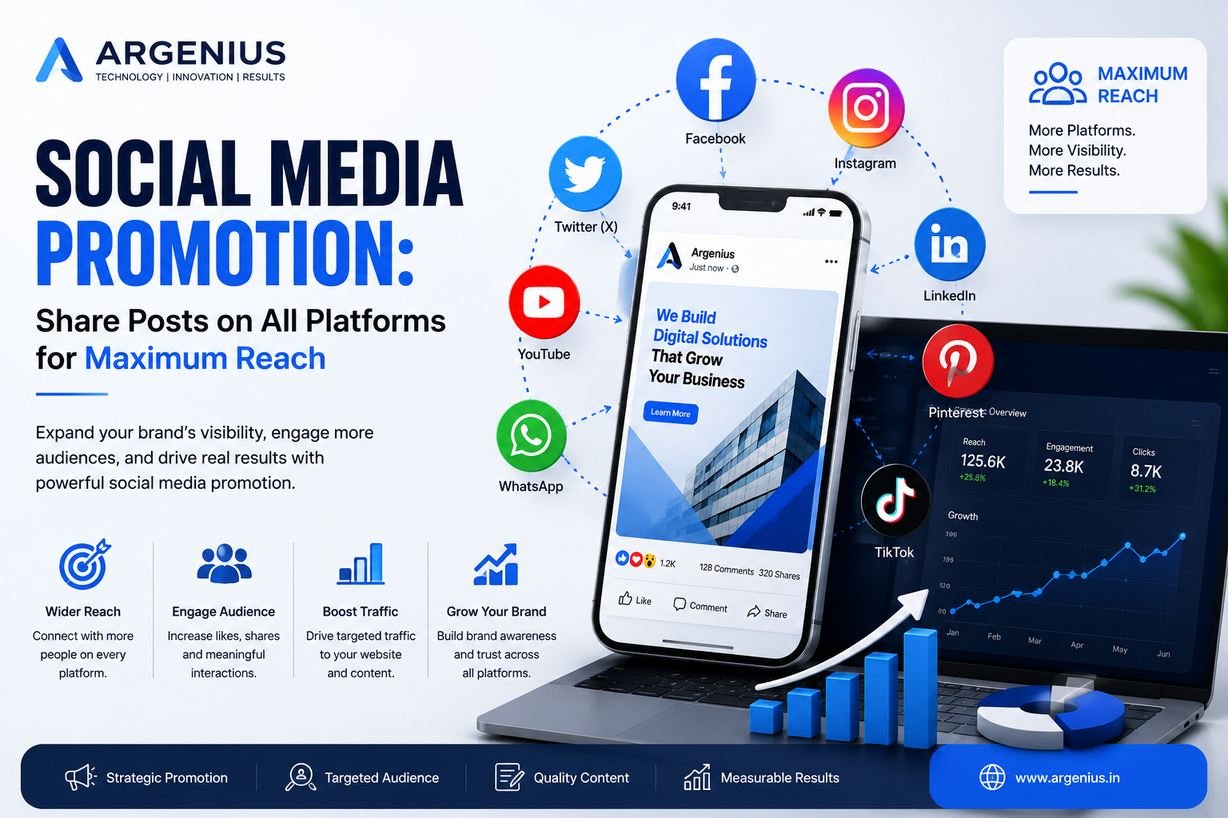
Step 8: Promote Your Infographic
Increase visibility by sharing it through:
- LinkedIn
- Facebook
- Instagram
- Pinterest
- X (Twitter)
- Email Marketing
- Industry Blogs
- Guest Posts
Promotion helps attract backlinks, shares, and referral traffic.
Infographic SEO Checklist
Before publishing your infographic, ensure you have:
- ✅ Keyword Research
- ✅ Descriptive File Name
- ✅ Optimized ALT Text
- ✅ Compressed Image
- ✅ Mobile-Friendly Design
- ✅ Supporting Article
- ✅ Internal Links
- ✅ Fast Loading Page
- ✅ Clear CTA
- ✅ Social Sharing Buttons
Following a checklist helps improve both image rankings and user experience.
Best Tools for Infographic SEO
Free Tools
- Google Search Console
- Google Analytics
- Google Trends
- Google PageSpeed Insights
- Google Keyword Planner
- TinyPNG
Premium Tools
- Ahrefs
- Semrush
- Surfer SEO
- Screaming Frog SEO Spider
- Adobe Illustrator
- Canva Pro
- Photoshop
These tools help with keyword research, image creation, optimization, and SEO performance monitoring.
Infographic SEO and AI Search
Visual content plays an increasingly important role in AI-powered search.
To improve visibility in Google AI Overviews, ChatGPT, Gemini, and Perplexity:
- Create informative infographics with original insights.
- Add descriptive captions and surrounding content.
- Use semantic keywords naturally.
- Optimize image filenames and ALT text.
- Keep visuals updated with current data.
- Strengthen internal linking.
- Publish infographics within comprehensive articles.
Well-optimized visuals enhance both traditional search performance and AI-driven content discovery.
Cost of Infographic SEO Services (₹ INR)
The cost depends on design complexity, research, and SEO optimization.
| Service |
Estimated Cost |
| Infographic Design |
₹5,000 – ₹15,000 |
| SEO Image Optimization |
₹3,000 – ₹8,000 |
| Infographic + SEO Blog |
₹8,000 – ₹20,000 |
| Monthly Visual Content Package |
₹30,000 – ₹80,000 |
| Enterprise Visual SEO Strategy |
Custom Pricing |
Factors Affecting Cost
Pricing depends on:
- Research Depth
- Design Complexity
- Data Collection
- SEO Optimization
- Content Writing
- Number of Graphics
- Branding Requirements
- Performance Monitoring
A professionally optimized infographic can continue generating traffic, backlinks, and brand exposure for years.
Best Practices
To maximize infographic performance:
- Design for readability first.
- Use accurate and verified data.
- Compress images without sacrificing quality.
- Add descriptive ALT text.
- Use keyword-rich filenames.
- Publish supporting written content.
- Optimize for mobile devices.
- Encourage sharing with embedded social buttons.
- Build relevant internal links.
- Update older infographics with fresh statistics.
These practices improve discoverability, user engagement, and long-term SEO value.
Common Mistakes to Avoid
Avoid these common mistakes:
- Uploading oversized image files
- Using generic filenames
- Missing ALT text
- Publishing without supporting content
- Poor mobile responsiveness
- Low-resolution graphics
- Keyword stuffing in image attributes
- Ignoring internal linking
- Outdated statistics
- Forgetting image compression
Optimizing every element improves both rankings and user experience.
Future Trends in Infographic SEO
Image search continues to evolve through AI and visual recognition technologies.
Key trends include:
- Google AI Overviews
- Generative Engine Optimization (GEO)
- Visual Search
- Google Lens Optimization
- Entity-Based SEO
- Interactive Infographics
- Image Structured Data
- AI-Generated Image Analysis
- Voice & Visual Search Integration
- Experience-Based Content
Businesses investing in high-quality visual content will gain an advantage as image search becomes increasingly sophisticated.
Why Businesses Choose Argenius
At Argenius, we combine creative design with technical SEO to produce infographics that attract attention, earn backlinks, and rank in Google Images.
Our Infographic SEO Services include:
- Infographic Design
- SEO Image Optimization
- Keyword Research
- Content Strategy
- Supporting SEO Blog Writing
- Image Compression & Performance Optimization
- Internal Linking Strategy
- Technical SEO
- Content Audits
- Monthly SEO Reporting
Our goal is to help businesses transform visual content into long-term SEO assets that increase organic traffic and strengthen brand authority.
Final Thoughts
Infographic SEO is much more than creating attractive visuals. It combines high-quality design, keyword research, image optimization, and content strategy to help infographics rank in Google Images, attract backlinks, and support broader SEO goals.
As search engines become better at understanding visual content and AI-powered search continues to evolve, optimized infographics are becoming valuable assets for improving online visibility. Businesses that invest in informative, well-structured, and technically optimized visuals can reach a wider audience while enhancing user engagement and building authority.
Whether you're creating educational resources, industry reports, product comparisons, or process diagrams, optimizing every infographic for search engines ensures your visual content continues delivering value long after it's published. Argenius helps businesses develop SEO-driven visual content strategies that generate sustainable organic traffic, improve image rankings, and support long-term digital growth.
Frequently Asked Questions
What is Infographic SEO?
Infographic SEO is the process of optimizing infographics so they rank in Google Images, improve organic visibility, attract backlinks, and support overall website SEO.
How do I rank an infographic in Google Images?
Use descriptive filenames, optimized ALT text, image compression, supporting content, internal links, structured data where appropriate, and publish the infographic on an authoritative page.
Does ALT text help Image SEO?
Yes. ALT text helps search engines understand the image's content, improves accessibility, and can contribute to better image search visibility.
Can infographics generate backlinks?
Yes. High-quality, data-driven infographics are often shared and referenced by other websites, making them an effective way to earn natural backlinks.
Do infographics help AI-powered search?
Yes. Informative visuals supported by well-structured content can improve visibility in Google AI Overviews, ChatGPT, Gemini, and Perplexity, especially when they clearly explain complex topics.
Does Argenius provide Infographic SEO services?
Yes. Argenius offers Infographic Design, Image SEO, Supporting Content Writing, Keyword Research, Technical SEO, Internal Linking Strategy, and Complete Visual Content Marketing Services to help businesses improve search visibility and drive organic growth.