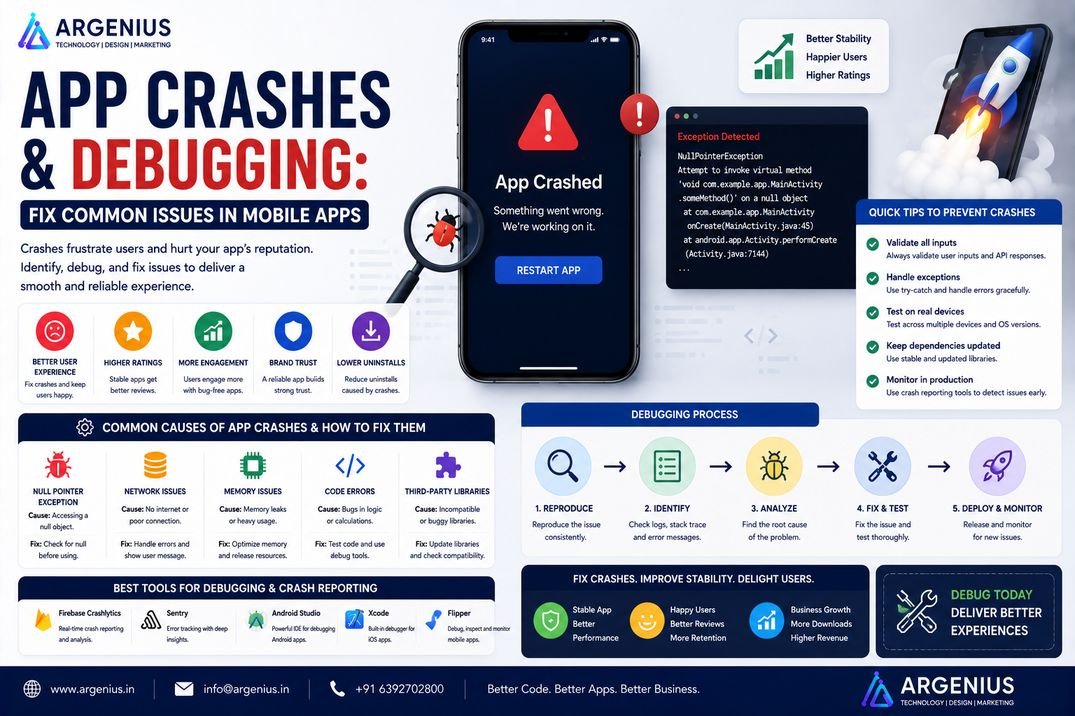
Application crashes frustrate users, reduce app ratings, and impact business growth. This complete guide explains how to identify crash causes, debug mobile applications efficiently, use crash reporting tools, and build stable Android and iOS applications.
A mobile application that crashes frequently can quickly lose user trust, reduce app store ratings, and negatively impact business growth. Studies consistently show that users are unlikely to continue using an app that crashes repeatedly or performs unreliably. Even a small number of crashes can result in abandoned sessions, lost revenue, and poor customer experiences.
App crashes can occur for many reasons, including memory leaks, unhandled exceptions, API failures, database issues, device compatibility problems, or operating system updates. While some crashes are easy to reproduce, others happen only under specific conditions, making them difficult to identify without proper debugging tools and monitoring systems.
Debugging is the systematic process of identifying, analyzing, and resolving software issues before they affect a larger number of users. Modern debugging goes beyond simply reading error logs—it includes crash reporting, performance monitoring, network analysis, memory profiling, automated testing, and continuous application monitoring.
Whether you're developing a Flutter application, React Native app, Android application, iOS application, or enterprise mobile solution, an effective debugging strategy is essential for delivering a stable and reliable user experience.
In this guide, you'll learn how mobile app crashes occur, common causes, debugging workflows, essential tools, performance optimization techniques, costs, and best practices for maintaining crash-free applications.
At Argenius, we help businesses identify, diagnose, and resolve application crashes using advanced debugging techniques, automated monitoring, and comprehensive quality assurance processes.
What are App Crashes?
An app crash occurs when an application unexpectedly stops working and closes due to an error that it cannot recover from.
Crashes may happen during:
- App Startup
- User Login
- Payment Processing
- Image Upload
- API Requests
- Database Operations
- Background Services
- Navigation
- Push Notifications
- File Downloads
A crash indicates that the application encountered a critical issue requiring developer attention.
Why Debugging is Important
Debugging ensures software reliability by identifying and resolving issues before they affect users.
Major benefits include:
- Better User Experience
- Higher App Stability
- Improved Performance
- Faster Issue Resolution
- Higher App Store Ratings
- Increased Customer Retention
- Better Security
- Reduced Downtime
- Lower Maintenance Costs
- Improved Business Reputation
An effective debugging process leads to a more reliable and trustworthy application.
Common Causes of App Crashes
Understanding why applications crash helps developers prevent similar issues in the future.
Common causes include:
- Null Pointer Exceptions
- Memory Leaks
- API Failures
- Database Errors
- Network Connectivity Issues
- Invalid User Input
- Device Compatibility Problems
- Outdated SDKs
- Permission Errors
- Infinite Loops
Identifying the root cause is the first step toward a permanent solution.
Types of Application Crashes
Different types of crashes require different debugging approaches.
Startup Crashes
The application crashes immediately after launching.
Possible causes:
- Missing Resources
- Configuration Errors
- Dependency Problems
- SDK Conflicts
Runtime Crashes
Crashes that occur while users interact with the application.
Examples:
- Button Clicks
- Navigation
- API Calls
- Payment Processing
Memory-Related Crashes
These occur when the application consumes excessive memory.
Common reasons:
- Memory Leaks
- Large Images
- Background Processes
- Unreleased Objects
Network Crashes
Network-related crashes happen when communication with servers fails unexpectedly.
Possible causes:
- Timeout
- API Failure
- Invalid Responses
- Connectivity Issues
Device Compatibility Crashes
Some crashes occur only on specific devices or OS versions.
Factors include:
- Android Fragmentation
- iOS Version Differences
- Screen Sizes
- Hardware Limitations
Debugging Workflow
A structured debugging workflow helps developers resolve issues efficiently.
Typical workflow:
- Reproduce the Crash
- Collect Logs
- Analyze Stack Trace
- Identify Root Cause
- Implement Fix
- Test the Solution
- Perform Regression Testing
- Deploy Update
- Monitor Production
- Verify Crash Resolution
Logging Best Practices
Effective logging simplifies debugging.
Important logs include:
- Error Logs
- API Logs
- Database Logs
- User Actions
- Performance Logs
- Authentication Logs
- Crash Reports
- Device Information
- Network Requests
- System Events
Proper logging provides valuable context for diagnosing issues.
Popular Debugging Tools
Modern development teams rely on specialized tools to identify and resolve application issues.
Recommended tools include:
- Firebase Crashlytics
- Sentry
- Android Studio Profiler
- Xcode Instruments
- Flutter DevTools
- Charles Proxy
- Postman
- New Relic
- Firebase Performance Monitoring
- Jira
These tools help developers monitor crashes, analyze performance, and improve application stability.
Common Debugging Techniques
Developers use several proven techniques to isolate and fix software issues.
Popular debugging methods include:
- Breakpoint Debugging
- Log Analysis
- Stack Trace Analysis
- Memory Profiling
- Network Inspection
- Unit Testing
- Integration Testing
- Device Testing
- Performance Profiling
- Code Review
Using multiple debugging techniques improves the chances of identifying complex issues quickly.
Industries That Need Reliable Debugging
Application stability is critical for many industries, including:
- Banking & FinTech
- Healthcare
- eCommerce
- Food Delivery
- Logistics
- Education
- Travel
- Social Media
- SaaS Platforms
- Enterprise Software
Even minor crashes in these industries can lead to financial losses and reduced customer trust.